Article

Addressing Climate Change Vulnerability in the IUCN Red List of Ecosystems—Results Demonstrated for a Cross-Section of Major Vegetation-Based Ecosystem Types in the United States

1
NatureServe, 3400 Table Mesa Drive, Suite 205, Boulder, CO 80305, USA
2
Institute for Applied Ecosystem Studies, Northern Research Station, US Forest Service, 5985 Co Hwy K, Rhinelander, WI 54501, USA
*
Author to whom correspondence should be addressed.
Land 2022, 11(2), 302; https://doi.org/10.3390/land11020302
Submission received: 3 December 2021 / Revised: 10 February 2022 / Accepted: 12 February 2022 / Published: 16 February 2022
(This article belongs to the Special Issue Identifying Endangered Terrestrial Ecosystems)

Abstract

:
The IUCN Red List of Ecosystems (RLE) is a global standard for ecosystem risk assessment that integrates data and knowledge to document the relative risk status of ecosystem types as critically endangered (CR), endangered (EN), and vulnerable (VU). A series of indicators for each type gauge the probability of range wide “collapse”. Climate change vulnerability can factor into RLE assessments, especially as indicators of climate change severity under the criteria for environmental degradation over the recent and upcoming 50 years. We applied a new framework to assess climate change vulnerability—and thus, severity of climate change degradation—to a cross-section of 33 upland ecosystem types in the United States to demonstrate this input to the RLE. The framework addressed climate exposure and ecosystem resilience. Measures of climate change exposure used climate projections for the mid-21st century compared against a 20th century baseline. Augmenting measures in use for RLE assessment, measures of resilience included several for adaptive capacity, including topoclimate variability, diversity with functional species groups, and vulnerability of any keystone species. All 33 types were listed as VU (n = 22), EN (n = 9), or CR (n = 2) and 51% scored at least one step higher (e.g., LC up to VU) from climate change severity.

1. Introduction

Ecosystem-focused risk assessment is critical to conserving ecosystem patterns and processes, linking species to ecosystem functions, and characterizing trends in the overall condition of regional landscapes. This need led scientists to develop methods for assessing ecosystem risk that complement species risk assessment [1]. Bolstered by the International Union for Conservation of Nature (IUCN), there is now a global standard for ecosystem risk assessment called the Red List of Ecosystems (RLE) [2]. Within North America, the RLE has been initially applied to terrestrial ecosystems [3,4].
Ecosystem risk assessments document risk of changing species composition and ecological processes. For ecosystems, the analog to species extinction is “ecosystem collapse”, or the transformation of species composition and ecological processes from that which was previously supported, along with loss of resilience [2]. The RLE framework identifies a series of criteria and indicators to apply range wide and then assign each ecosystem type to red list categories of collapsed (CO), critically endangered (CR), endangered (EN), vulnerable (VU), near threatened (NT), least concern (LC), data deficient (DD), or not evaluated (NE).
Climatic regimes drive ecosystem productivity and natural dynamics, such as the rate of plant growth, the frequency of natural wildfire, and seasonal streamflow [5], and we know that past episodes of climate change triggered transformation of natural communities with varying speed and magnitude [6,7]. As the rate of climate change increases, we can expect altered productivity, species turnover, local extinctions, and many forms of ecosystem collapse [8].
Therefore, RLE assessments should seek to incorporate the likely effects of climate change into an overall assessment of ecosystem risk. Both scientific justification [2] and practical guidance [9] have been provided for applying RLE criteria and indicators to any given ecosystem type. The primary assessment criteria are organized by letters A–D (Table 1). Climate change effects are most likely to be addressed under RLE Criterion A2 (a and b) or C2 (a and b). For example, sea level rise could result in loss in extent of coastal ecosystem types, such as a type of coastal mangrove or salt marsh. The indicator would be the estimated loss occurring over the next 50 years (A2a) from the (current) time of assessment. Alternatively, if perhaps that loss had started in 1990, under A2b, a 50-year period extending from 1990–2040 would be used (i.e., overlapping the current time of assessment). Under C2 criteria, one could use indicators to measure relative severity of climate-induced ecosystem stress occurring over a proportion of the ecosystem extent as environmental degradation occurring within the above or similar timeframes.
Under each indicator of environmental degradation, the combination of extent and level of severity in each timeframe results in a categorization of relative risk of range wide ecosystem collapse (i.e., critically endangered (CR), endangered (EN), vulnerable (VU), etc.). Indicators must quantify (a) the relative proportion of the range wide distribution of the ecosystem type impacted, and (b) that impact should differentiate levels of relative severity. The combinations of each factor correspond to a level of risk of ecosystem collapse. For instance, under Criterion C2 for environmental degradation, a type could surpass the threshold for listing as VU if >30% of its extent occurs with >80% severity, or >50% of extent occurs with >50% severity, or >80% of extent occurs with >30% relative severity (Table 2). Overall RLE status is then based on the most severe rating of any of the component indicator scores, i.e., if a type scores as CR under any indicator, it will receive an overall score of CR.
Therefore, a spatially explicit indicator of climate change vulnerability for natural ecosystem types could serve to indicate relative severity of environmental degradation in RLE risk assessments to quantify risk of ecosystem collapse. While most climate change vulnerability assessments focus on individual species, here we demonstrate methods suitable for ecosystems. NatureServe’s Habitat Climate Change Vulnerability Index (HCCVI) [10] results in a repeatable and transparent index to express the relative severity of environmental degradation occurring for a given ecosystem type in all or part of its distribution, so this should serve as a suitable indicator for C2 (a and b) criteria for red listing ecosystem types.
This assessment builds upon prior efforts to address major upland vegetation types occurring across the United States [10], with an initial focus on types occurring in a cross-section of ecological contexts for upland ecosystems, extending from the Mediterranean climate of California, interior western mountains and cold deserts, prairies of the Great Plains, and both northeastern and southeastern forests. Below, we summarize our methods and findings for all 33 types that today extend over 1.64 million km2 (21%) of the conterminous United States. We then discuss implications for linking these two assessment frameworks for ecosystem risk assessment.

2. Materials and Methods

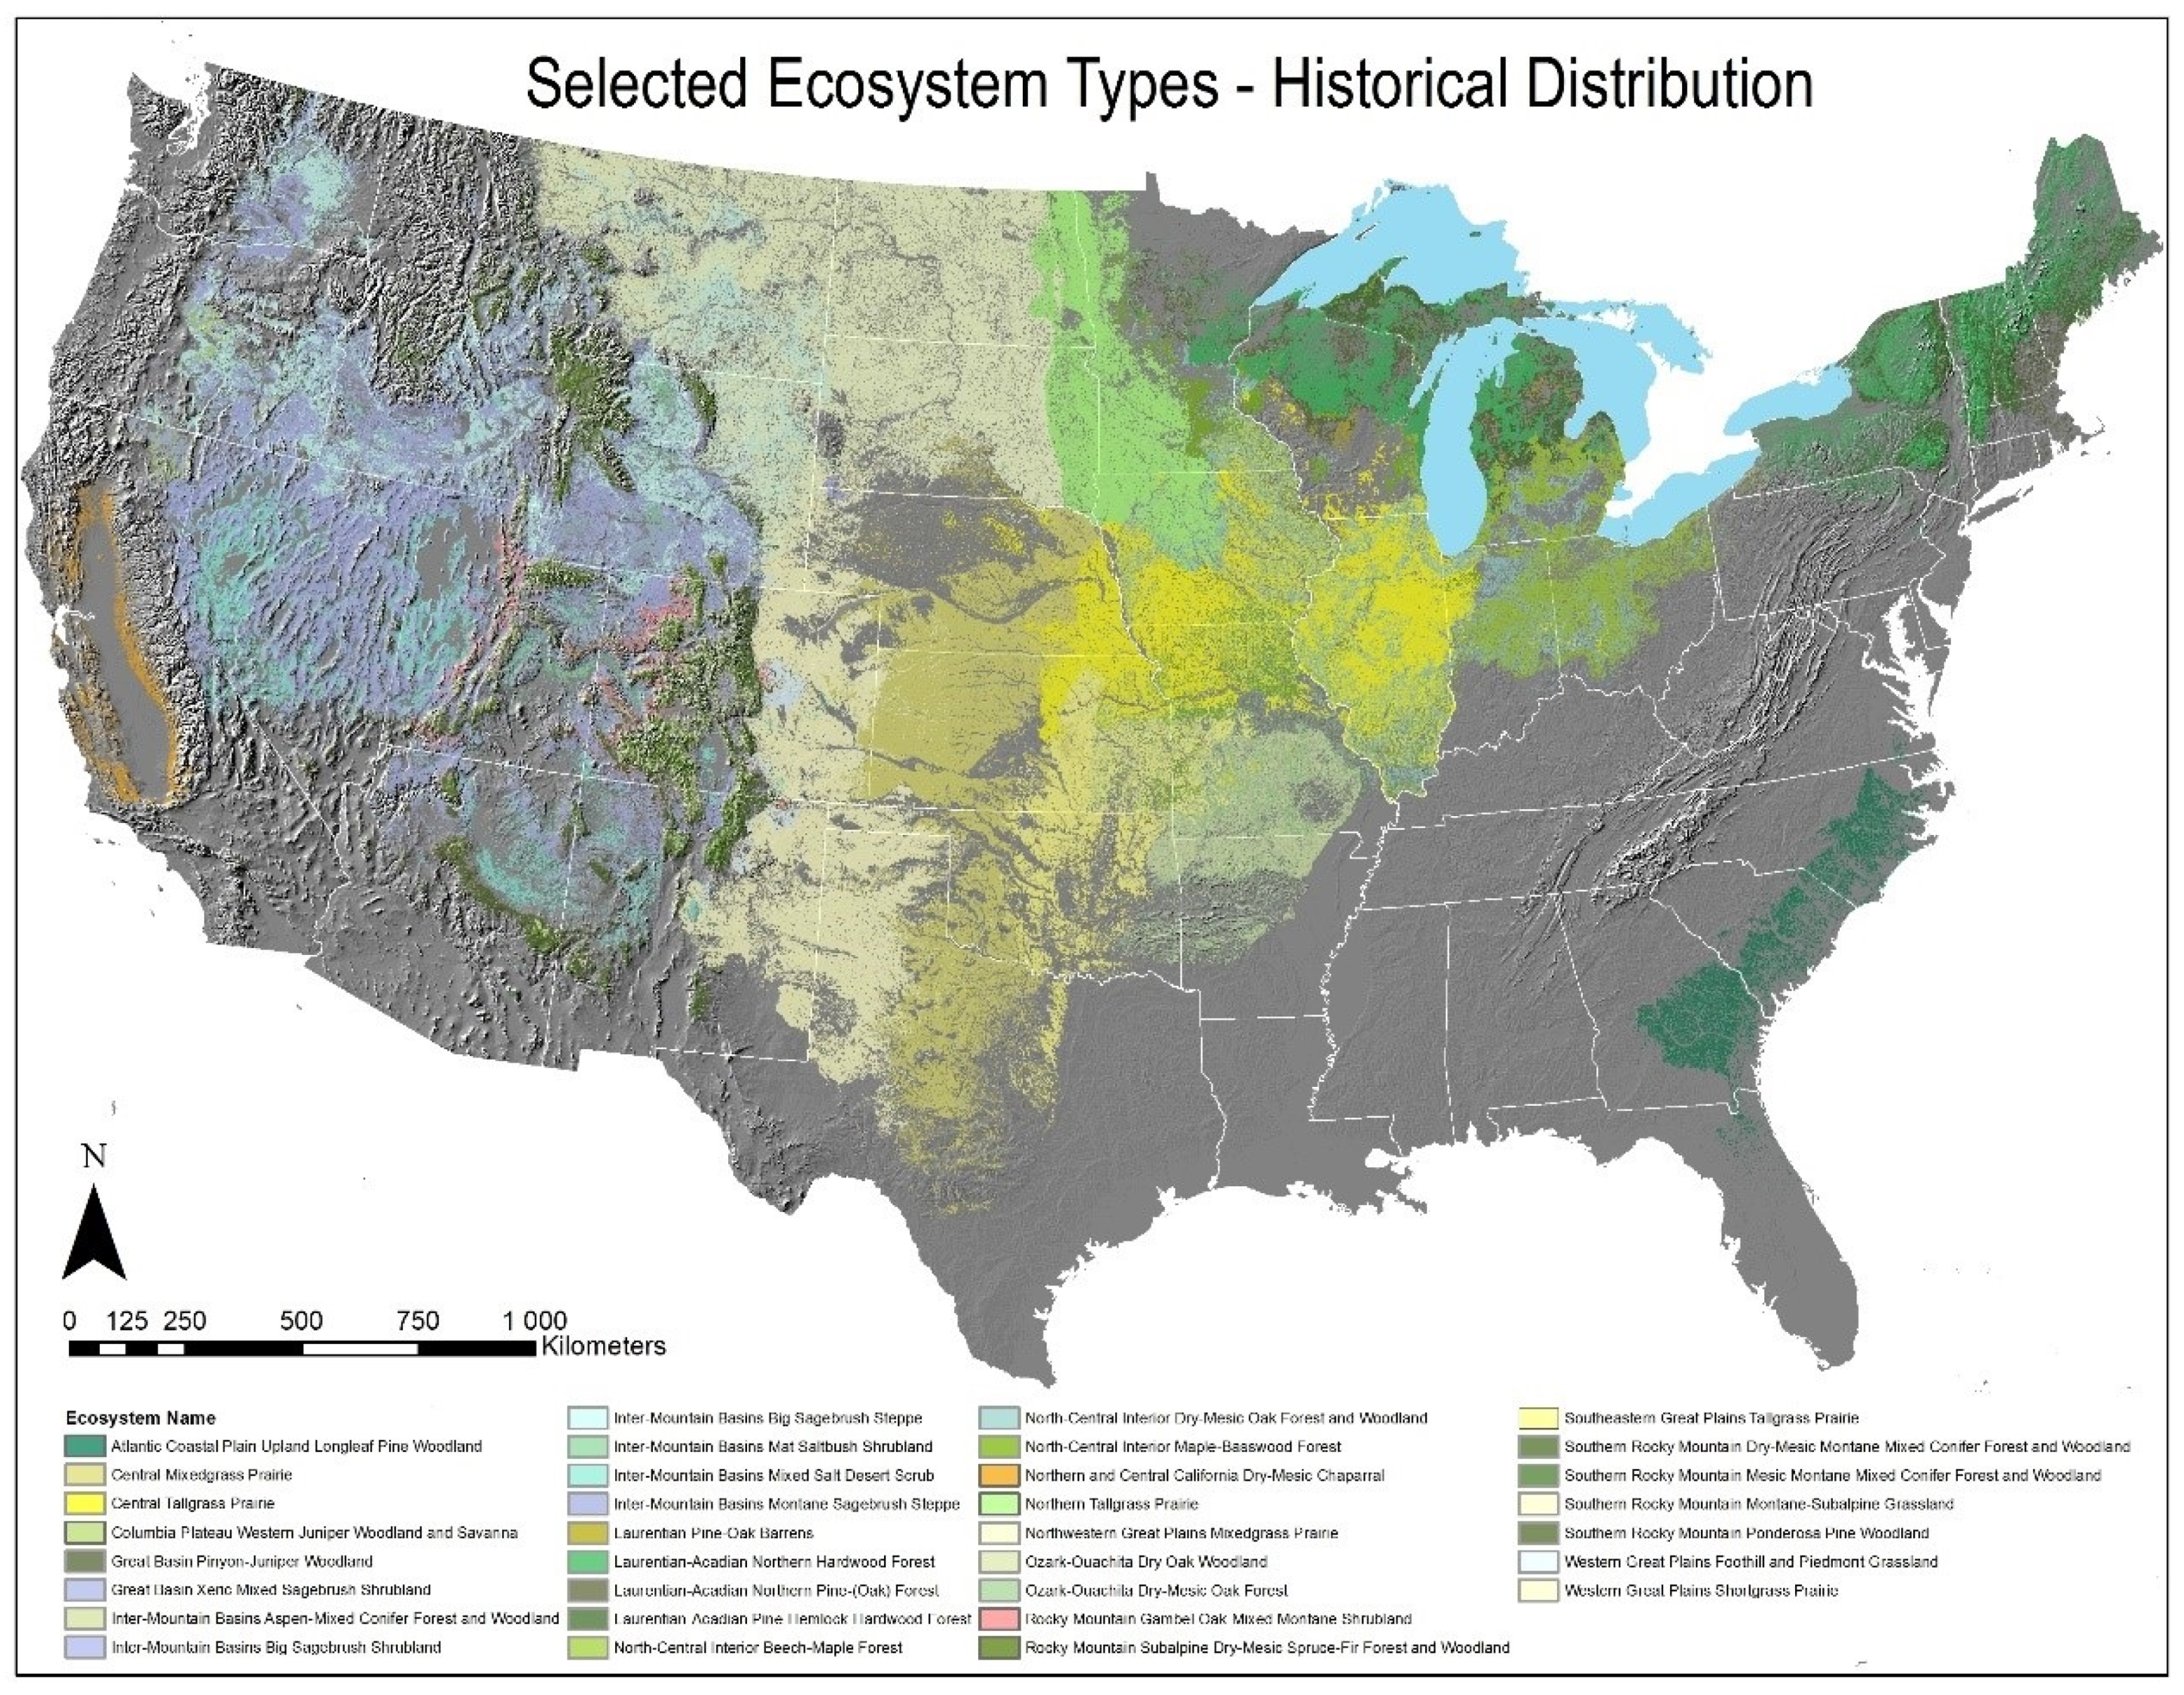
2.1. Ecological Classification and Distribution

We used NatureServe’s terrestrial ecological systems classification to define types [11] with descriptions of each type found at www.natureserveexplorer.org (accessed on 1 June 2021). It includes several hundred upland and wetland types that have been utilized by US natural resource agencies [12,13] and mapping has been extended into adjacent countries [14]. Here, we focused solely on 33 upland types. The expected historical or “potential” natural distribution of each type was used as the base distribution for assessment in order to represent the full range of variation in climate that encompasses the type (Figure 1).
Below, we discuss measures for climate change vulnerability applied to each type for a complete measure.

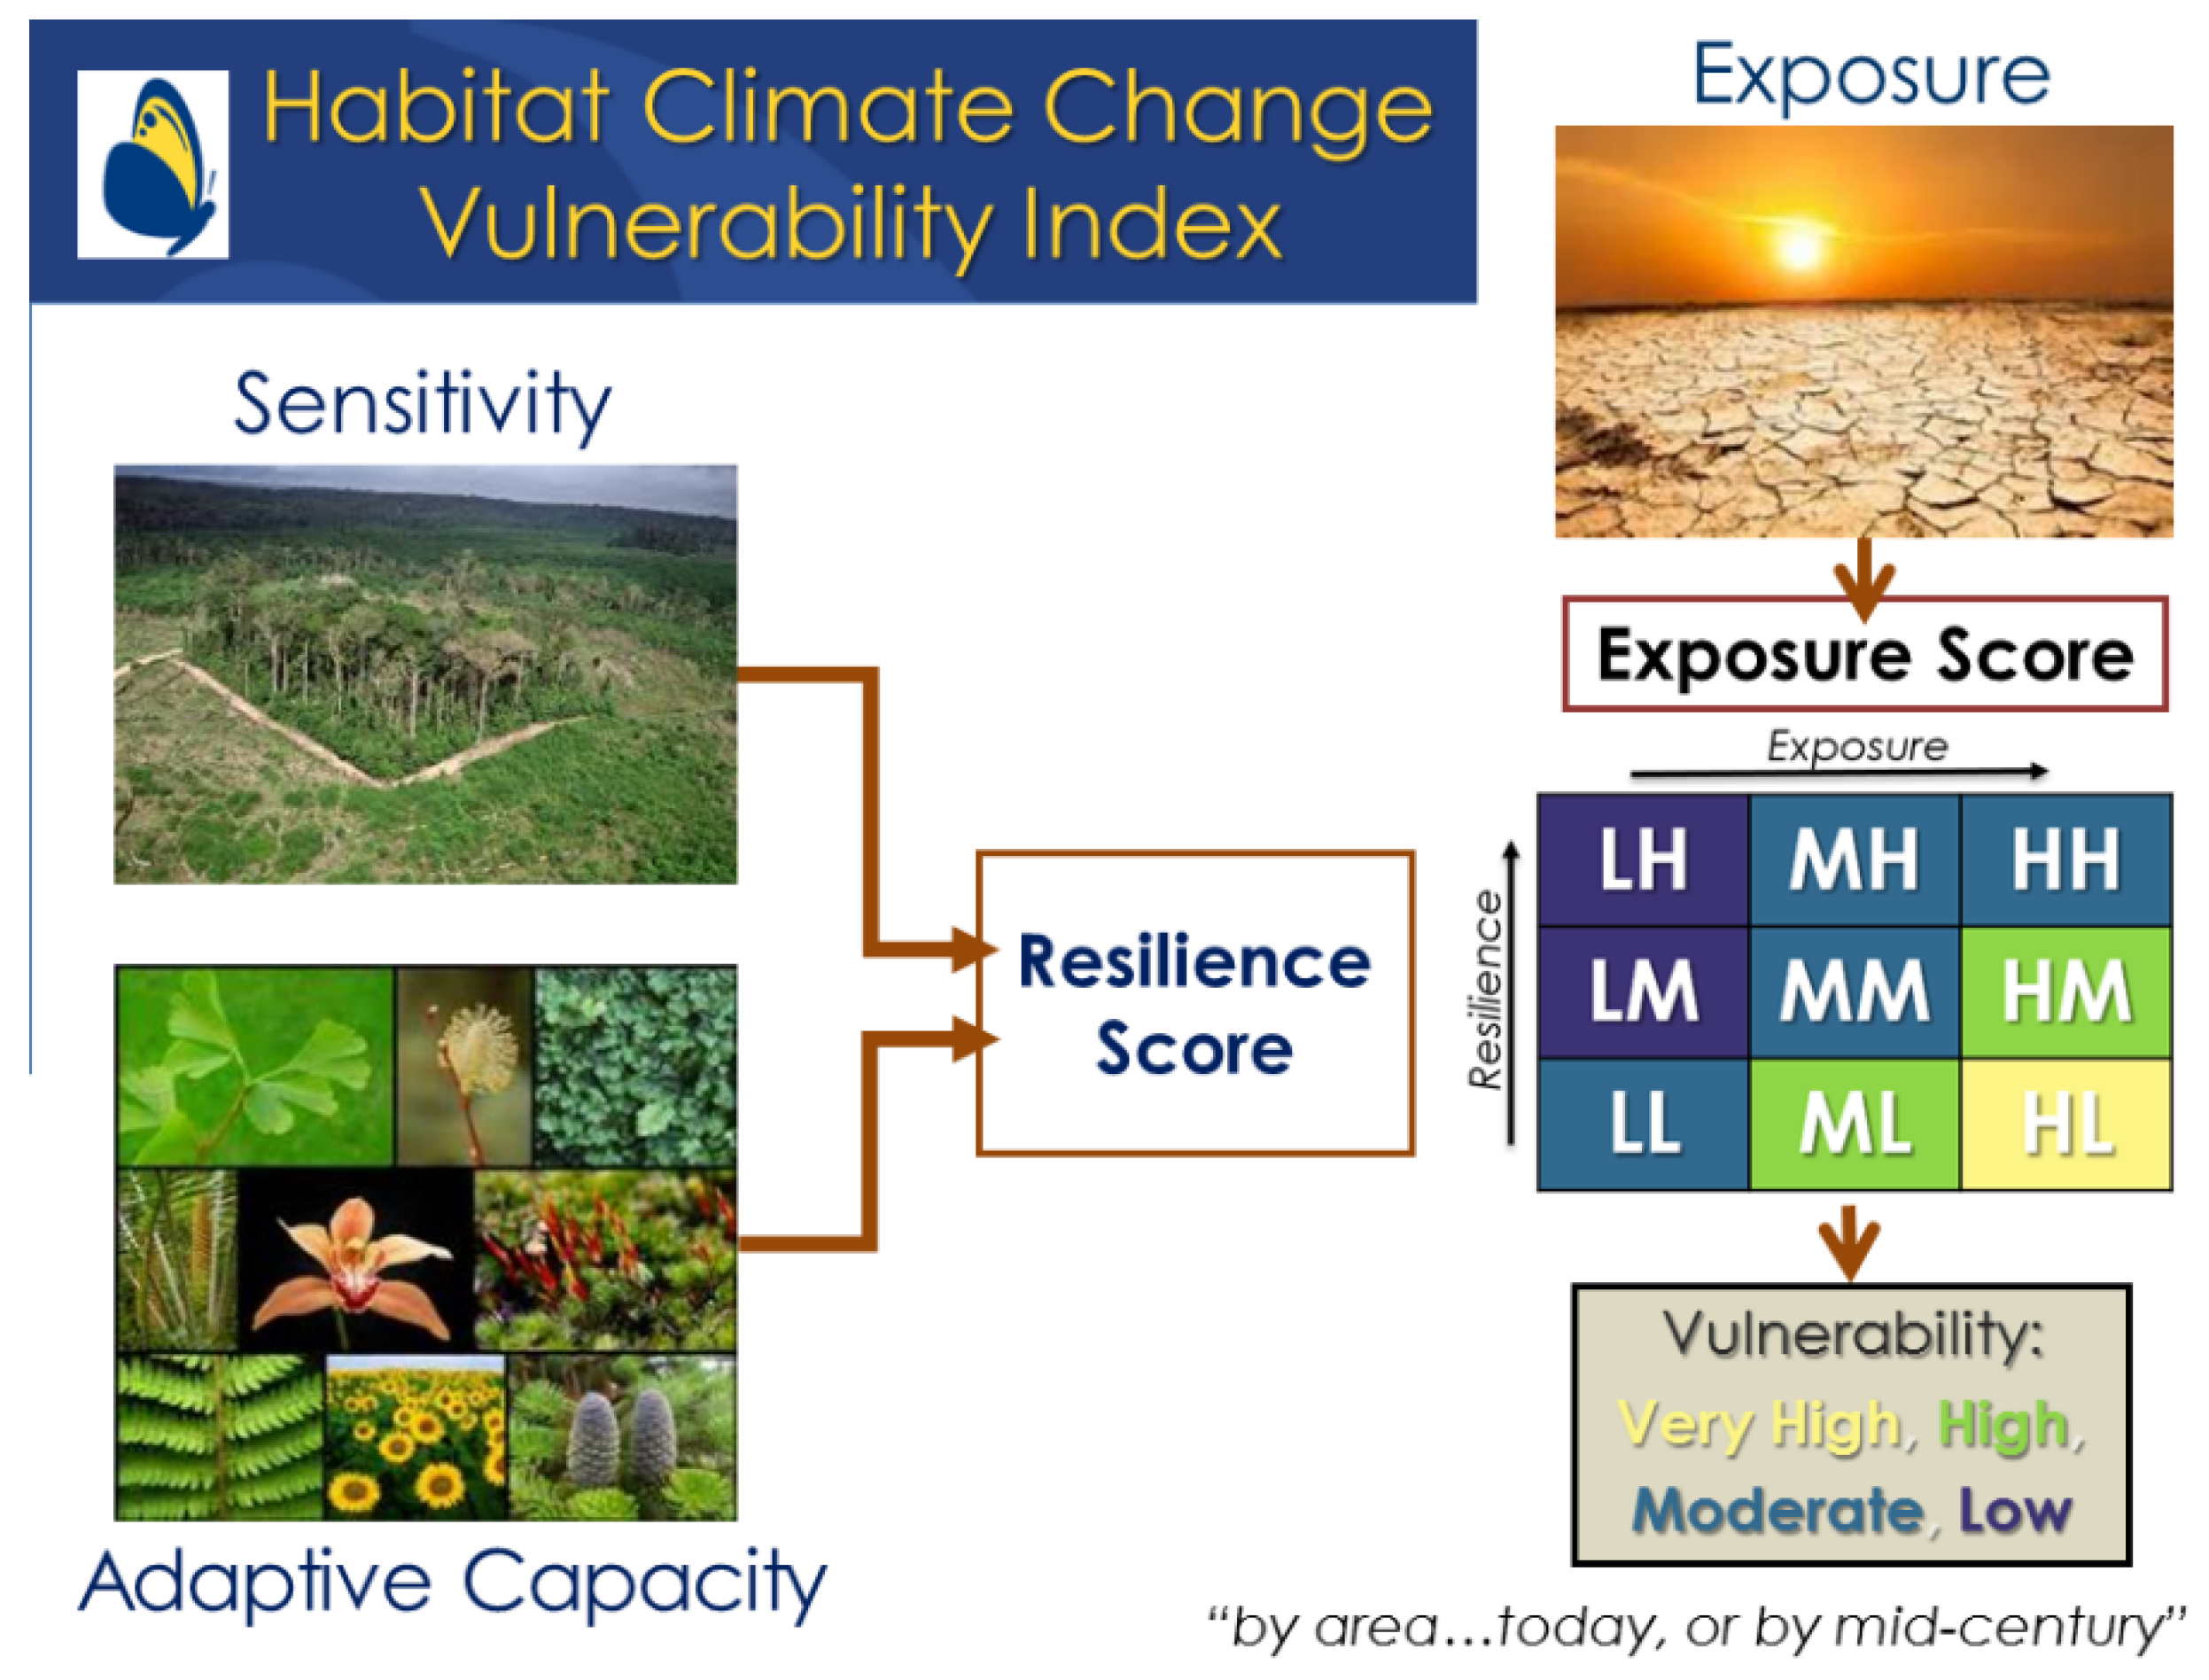
2.2. Analytical Framework for Vulnerability Assessment

Background, detailed methods, and applications of the HCCVI have been documented elsewhere [10]. Much like the RLE, this index approach to vulnerability assessment includes a series of subanalyses that will shed light on distinct components of vulnerability, so that each can be evaluated individually, or in combination. The components of climate change vulnerability are organized into primary categories of Exposure and Resilience. Resilience is further subdivided into subcategories of Sensitivity and Adaptive Capacity. Climate change exposure and resilience are then considered together to arrive at an overall gauge of climate change vulnerability (Figure 2). When using quantitative data for measurement, numerical scores are normalized to a 0.0 to 1.0 scale, with 0.0 indicating ecologically “least favorable” conditions, and 1.0 indicating “most favorable” conditions. Quartiles of each continuous measure may be used as a starting point to determine the range falling into each of the Very High–Low categories (e.g., ≥0.75 = Low, 0.5–0.75 = Moderate, 0.25–0.50 = High, and ≤0.25 = Very High overall vulnerability).
These categories for vulnerability translate directly to the RLE framework for relative severity, with low, moderate, high, and very high severity for application under the C2 criteria (Table 2). These categories are defined as:
  • Very High climate change severity results from combining high exposure with low resilience (i.e., both trending toward “least favorable” scores). Ecosystem transformation is most likely to occur in these types. This HCCVI result equates to “80%” severity for RLE application.
  • High climate change severity results from combining either high or moderate exposure with low or medium resilience. This HCCVI result equates to “50%” severity for RLE application.
  • Moderate climate change severity results from a variety of combinations for exposure and resilience; initially with circumstances where both are scored as moderate. This HCCVI result equates to “30%” severity for RLE application.
  • Low climate change severity results from combining low exposure with high resilience (i.e., both trending toward “most favorable” scores). This HCCVI result equates to “<30%” severity for RLE application, and therefore does not affect RLE scoring.

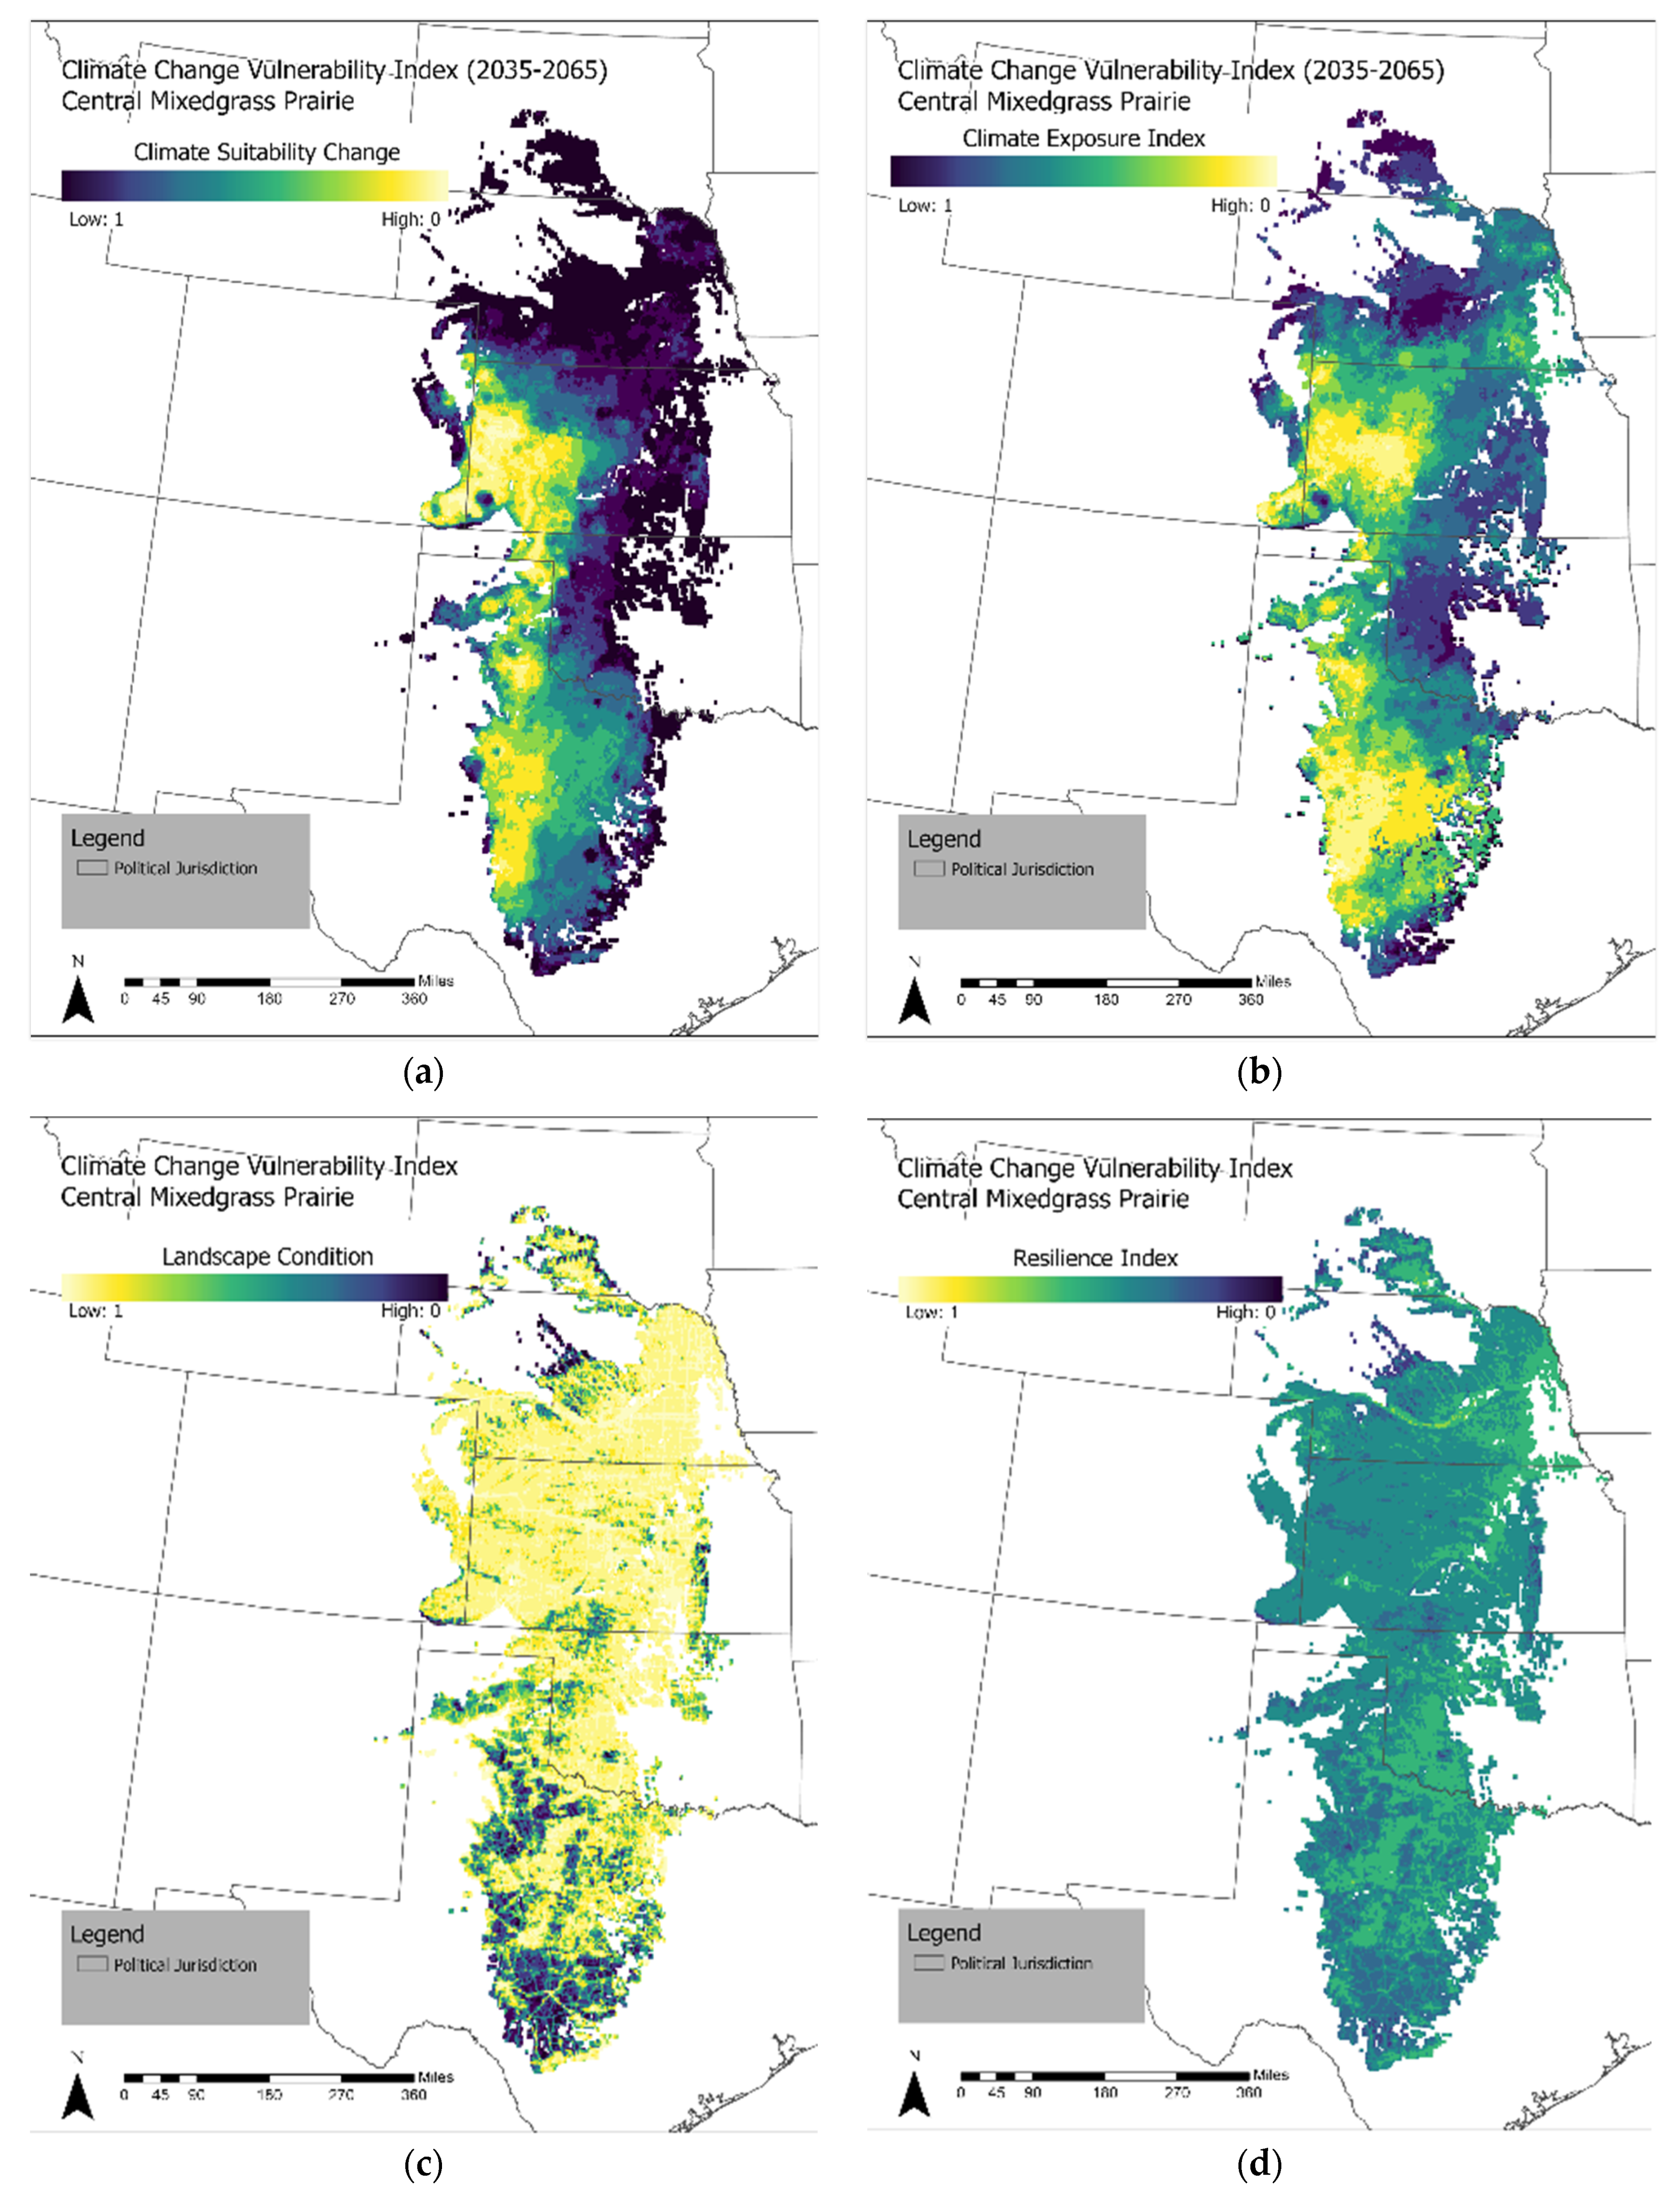
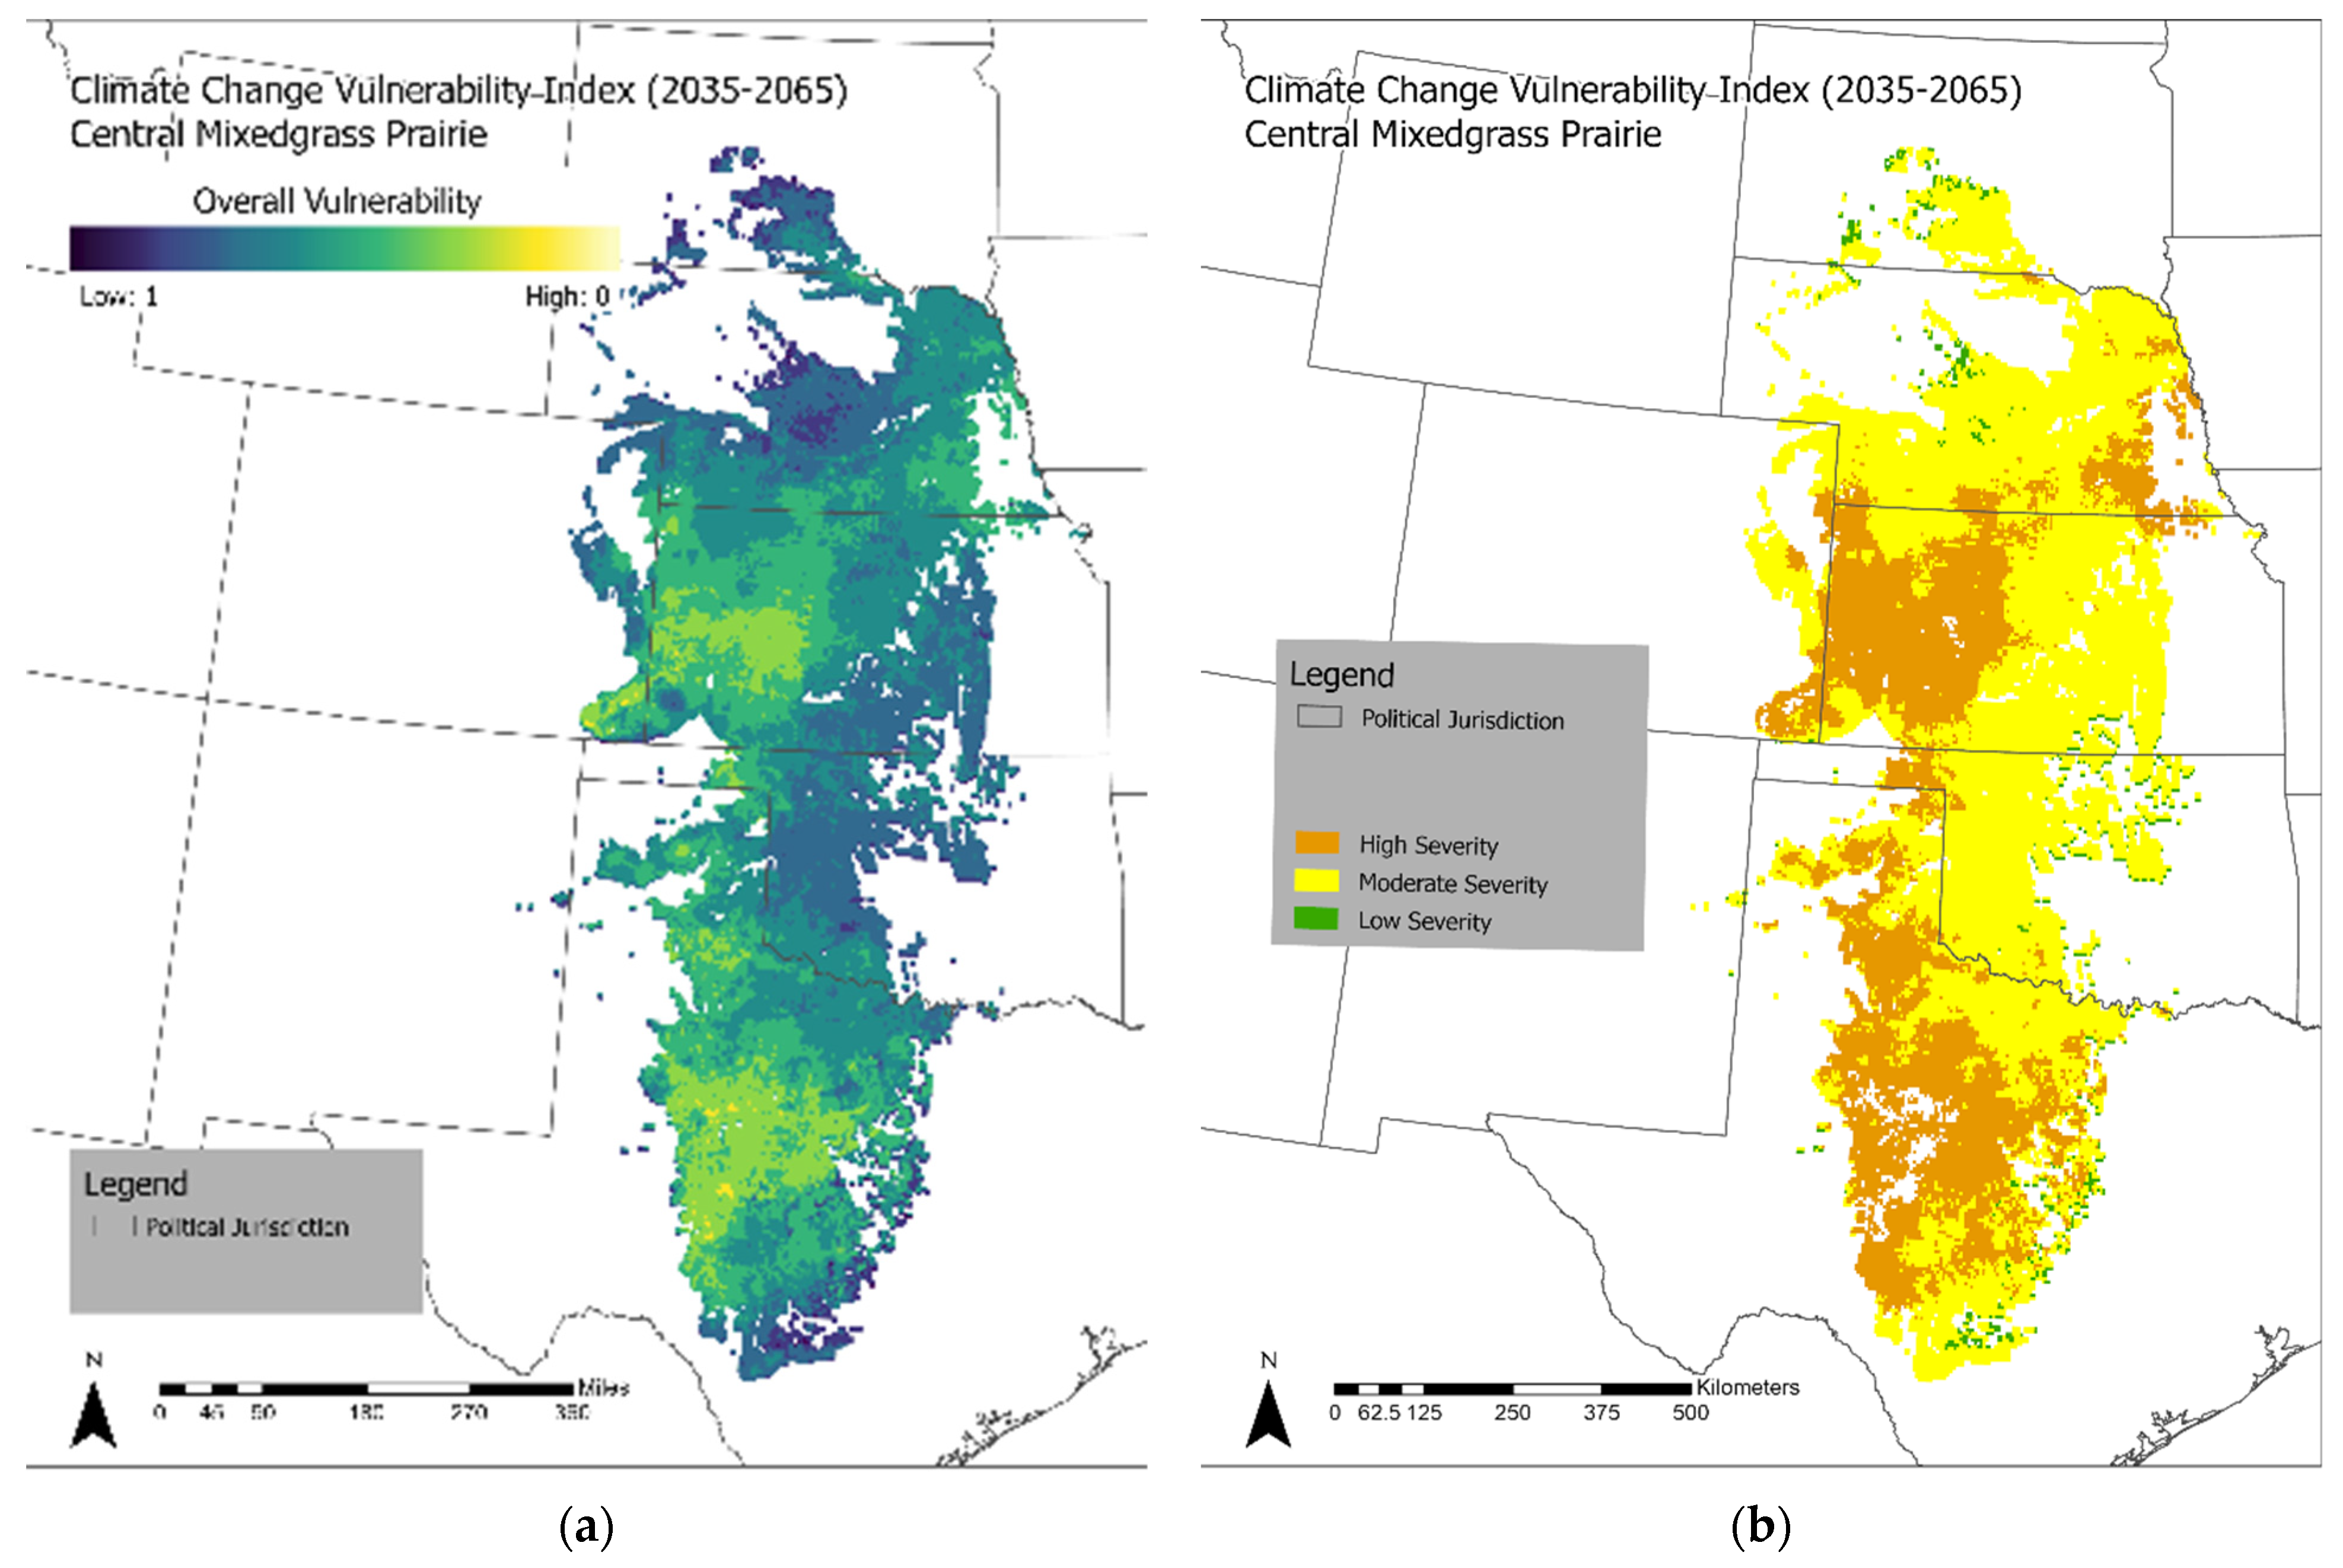
2.3. Measuring Climate Change Severity

See Comer et al. [10] for a detailed explanation of component exposure and resilience measures of the HCCVI. For purposes of illustrating our methodology, we will use one example—Central Mixedgrass Prairie—to depict component steps of the HCCVI framework as it is applied to the Red List of Ecosystems (Figure 3). Again, here we translate HCCVI measures of climate change vulnerability directly to estimates of climate change severity under the Red List of Ecosystems. For this effort, we summarized component measurements by a 4 × 4 km2 grid for the distribution of each ecosystem type. We characterized the baseline climate niche for each ecosystem type using observed climate data for the 1976–2005 time period and the potential historical distribution of the type. Exposure measures were calculated based on changes in 19 bioclimatic variables derived from monthly temperature and precipitation variables [15]. For every grid cell of each ecosystem type we calculated a composite index of climate change exposure as the sum of two distinct exposure measures: suitability change, which quantifies departure from the historical range of spatial climate variability across the geographic range of that ecosystem type (Figure 3), and climate departure, which quantifies departure from the historical range of year-to-year climate variability at a given pixel location. We estimated overall exposure against our baseline time period for projected future change (2035–2065, RCP 8.5) (Figure 3).
HCCVI measures of Resilience address predisposing conditions—such as extant ecosystem stressors, or natural abiotic or biotic characteristics of the type—that are likely to affect ecological responses of the natural ecosystem to changing climate. For example, if exposure measures indicate the need for component species to migrate, but the natural landscape is fragmented by intensive land uses, the relative vulnerability of community types in that fragmented landscape could increase [16]. Similarly, the introduction of non-native species may displace native species and/or alter key dynamic processes such as wildfire regimes [17], and both could be exacerbated by climate change. These factors would describe relative climate change Sensitivity for a given natural ecosystem type. Within the HCCVI framework, Sensitivity components of Resilience coincide with measures applicable to C1 and C3 (Environmental Degradation) measures and D1 and D3 (Disruption of Biotic Processes) measures under the Red List of Ecosystems framework (Table 1). To address effects of landscape fragmentation, we used a spatial model for landscape intactness or condition (Figure 3). Since many assessed types are known to be affected by invasive annual grass invasion, a model aiming to measure relative invasion severity was selected. Similarly, since most assessed types have a characteristic natural wildfire regime, a spatial model estimating fire regime departure was used. For forest types, measures of elevated risk from insects or diseases were identified [18].
The HCCVI measures adaptive capacity considering the natural geophysical variability in climate for the type’s distribution or the functional roles of species in the ecosystem type [10]. In each Resilience indicator involving spatial models, the model was overlaid with the distribution of each ecosystem type and scores were transformed to indicate a relative degree of sensitivity or adaptive capacity within a 0.0–1.0 range, again with 0.0 indicating the most severely impacted, or least favorable, conditions while 1.0 indicates the highest integrity, or apparently unaltered, conditions. These scores were each summarized to average values per 4 × 4 km2 pixel. Overall Resilience scores were derived by averaging results for each measure of Sensitivity and for Adaptive Capacity (Figure 3). This combination of Sensitivity measures and Adaptive Capacity measures were averaged together per 4 × 4 km2 pixel to establish and overall score for Resilience.
As described in Figure 1, patterns of relative severity in each type vary across its distribution, as depicted with 4 × 4 km2 pixels. While per-pixel outputs are summarized along the 0.0–1.0 continuum, summary statistics for climate change severity were expressed as “Very High” (=“>80%”), “High” (=“>50%”), “Moderate” (=“>30%”), or “Low” (=“<30%”) severity. Here, we used default break-points with quartiles of each continuous measure to determine the range falling into each category (≥0.75 = Low = “<30% severity”, 0.5–0.75 = Moderate = “>30% severity”, 0.25–0.50 = High = “>50% severity”, and ≤0.25 = Very High = “>80% severity”). In the case of the Central Mixedgrass Prairie, about 44% of its distribution is forecasted to fall within the “Moderate” or “>30% severity” group and about 55% in the “High” or “>50% severity” group (Figure 4).

2.4. Relative Climate Change Severity Applied to Red List Criterion C2b

The relative climate change severity, as calculated from the HCCVI framework, translates directly to relative severity measures as summarized in Table 2. Thus, the proportional area of each ecosystem type scoring “Low” to “Very High” relative climate change severity determines the IUCN Red List status under C2b (Table 2).

3. Results

The summarized results for overall climate change vulnerability of the assessed types are found in Table 3. Results for the 33 ecosystem types were arranged into 10 categories that reflect major ecological gradients, from high-elevation “Cool Temperate Subalpine Woodlands” to “Warm Temperate Grasslands”. Table 3 provides a high-level summary of analysis scores and overall results for each ecosystem type, with proportions of their respective distributions falling in each category (Very High–High–Moderate–Low) of climate change severity. On the left are results pertaining to the other red list categories. On the right are results using climate change severity measures for the 2035–2065 timeframe. For additional detail, type-specific tabular summaries of each HCCVI measure are found in File S1 (Supporting Information).

3.1. RLE Results Prior to Application of Criterion C2b

Among this cross-section of 33 types scored under the RLE, 2 types score as CR, 6 as EN, 12 as VU, and 13 as LC and/or NT (Table 3). Both Central and Northern Tallgrass Prairie types score as CR given their near complete conversion to cropland over the past 200 years. Those types considered EN were concentrated in eastern forests occurring in the Great Lakes region, the Ozark and Ouachita Mountains, and Atlantic Coastal Plain. These include North Central Interior Beech–Maple Forest, North Central Interior Maple–Basswood Forest, Ozark Ouachita Dry–Mesic Oak Forest, Ozark Ouachita Dry Oak Woodland, Atlantic Coastal Plain Upland Longleaf Pine Woodland, and Laurentian Pine Oak Barrens. All types occurring on soils with high potential for agricultural production were severely affected by land conversion, especially in the early 19th century [19]. Dry oak and pine woodlands and open-canopy “barrens” were also historically fragmented by (often unsuccessful) attempts at agricultural production, but wildfire suppression in these fire-dependent ecosystems resulted in successional closure of tree canopies and loss of many shade-intolerant species.
Types scoring as VU are found across most categories for our selected types driven by the combination of land conversion, fragmentation and alterations to natural disturbance regimes. Western montane forests, including Southern Rocky Mountain Dry–Mesic Montane Mixed Conifer Forest and Woodland, and Southern Rocky Mountain Ponderosa Pine Woodland, were impacted by wildfire suppression throughout much of the 20th century [20]. Elsewhere across the west, Inter-Mountain Basins Big Sagebrush Steppe has been impacted by agricultural land conversion is some areas, but overall, non-native plant invasion and interacting effects on natural wildfire regimes [21] have severely degraded these ecosystems across their vast distribution. Found throughout the Mediterranean climate of North America, the Northern and Central Californian Dry–Mesic Chaparral has been severely impacted by landscape fragmentation [22]. Found throughout the upper Great Lakes region, the Laurentian Acadian Pine–Hemlock–Hardwood Forest and Laurentian Acadian Northern Pine–Oak Forest have also been impacted by past timber harvest and landscape fragmentation. Located further south than these, the North Central Interior Dry–Mesic Oak Forest and Woodland have been extensively converted for agricultural land uses and recovering remnants have been affected by wildfire suppression [23]. Found throughout the Flint Hills of Kansas and adjacent Oklahoma, the Southeastern Great Plains Tallgrass Prairie has largely escaped widespread conversion for agriculture because it occurs on relatively thin soils, but severe fragmentation immediately adjacent to remnants make it vulnerable to exotic species invasion [24].
Those types scoring in the least threatened categories of NT or LC are concentrated in northern, higher elevation, or more arid conditions with limited potential for agricultural land conversion, wildfire suppression, or invasive species effects (Table 3).

3.2. RLE Results with Application of Criterion C2b

Application of the HCCVI to these types demonstrates the effect of increasing climate exposure (as of the 2035–2065 timeframe). By that time period, all but one of these types is projected to have >50% of their distribution with scores in the Moderate (index value ≥ 0.5 and <0.75), High (index value ≥ 0.25 and <0.5), or Very High (index value < 0.25) HCCVI categories (Table 3). Exceptions include Southeastern Great Plains Tallgrass Prairie, Western Great Plains Shortgrass Prairie, Northwestern Great Plains Mixedgrass Prairie, and Great Basin Xeric Mixed Sagebrush Shrubland, with >54% scored as low exposure.
Component HCCVI measures of resilience also contributed to moderate-to-very high climate change severity measures. Under Adaptive Capacity, topoclimate [10] is very low for many of these ecosystem types, especially those occurring across the east, Great Plains, and western intermountain basins. Low topoclimate variability suggests that for a given increment of climate change, species assemblages in these areas would more likely need greater range shifts to stay within historic climate niches than species occurring in more topographically varied landscapes with greater microclimate variability [25,26], Conversely, areas of lower climate change velocity have historically supported greater endemism perhaps as more taxa survived climate change over much longer periods [27]. High severity scores for Diversity within Functional Species groups [10] also contributed to climate change severity in a number of ecosystem types. With increasing climate stress, individual species may be lost over time, so low diversity within key functional species groups increases climate change vulnerability, and therefore severity. Keystone species, i.e., individual species presumed to play unique critical functional roles [10], were limited in the ecosystem cross-section to black-tailed prairie dogs (Cynomys ludovicianus) that provide a keystone function in prairies of the western Great Plains. However, in these cases, low climate change vulnerability for this species confers limited vulnerability to the prairie types.
The Sensitivity component of Resilience measures addresses current (and if possible, predicted) ecological condition or integrity of a given ecosystem type [10]. Ten of these types include >50% of the type distribution scores in the High (index value ≥ 0.25 and <0.5), or Very High (index value < 0.25) sensitivity. These include Laurentian Acadian Northern Hardwood Forest, Laurentian Acadian Pine–Hemlock–Hardwood Forest, Ozark Ouachita Dry–Mesic Oak Forest, North Central Interior Maple–Basswood Forest, Laurentian Acadian Northern Pine–Oak Forest, Laurentian Pine Oak Barrens, Central Mixedgrass Prairie, Central Tallgrass Prairie, Northern Tallgrass Prairie, and Southeastern Great Plains Tallgrass Prairie.
In a number of these selected types, poor landscape condition (i.e., high fragmentation), invasive species presence and abundance, wildfire regime and vegetation structural departure, and (for selected forest types) forest insect and disease losses [10] all contributed to decreased ecosystem resilience. Again, for a given level of climate change exposure, ecosystem types occurring in already compromised condition are safely presumed to be more sensitive to that climate stress, so severity is heightened [10].
As a result, all but one of these types include >80% of the type distribution scores in the Moderate (≥30%) or High (≥50%) relative severity. The one exception includes Great Basin Xeric Mixed Sagebrush Shrubland with 70% in the Moderate (≥30%) severity and 30% scoring as Low (≤30%) severity
Table 3. NatureServe terrestrial ecological system types assessed for both the IUCN Red List of Ecosystems and for climate change severity, with percentage of mapped area that was scored from Low to Very High severity using climate projections to the mid-21st century (2035–2065) timeframe.
IUCN Red List of Ecosystems (RLE) Results with and without HCCVI Application to Criterion C2bPotential/
Historic Extent (km2)
RLE with HCCVI (C2b)RLE C2bRLE w/out HCCVI (C2b)RLE A3RLE B1RLE B2RLE C3RLE D3Climate Change Severity
(RCP8.5) 2035–2065
Very HighHighModLow
≥80% Severity≥50% Severity≥30% Severity<30% Severity
Terrestrial Ecological System Types(% Area)(% Area)(% Area)(% Area)
Western Cool Temperate Subalpine Woodlands
Rocky Mountain Subalpine Dry–Mesic Spruce–Fir Forest and Woodland94,256VUVULCLCLCLCDDLC0%49%49%2%
Aspen Forests and Woodlands
Inter-Mountain Basins Aspen–Mixed Conifer Forest and Woodland27,929VUVUNT (LC-VU)DDLCLCVULC0%17%75%8%
Montane Conifer Forests and Woodlands
Southern Rocky Mountain Dry–Mesic Montane Mixed Conifer Forest and Woodland15,430VUVUVULCLCLCVULC0%26%56%18%
Southern Rocky Mountain Mesic Montane Mixed Conifer Forest and Woodland8961VUVUNT (LC-VU)LCLCLCVULC0%24%61%14%
Western Pine Woodlands
Southern Rocky Mountain Ponderosa Pine Woodland38,713VUVUVULCLCLCVULC0%40%52%8%
Great Basin Pinyon–Juniper Woodland22,304VUVUNTLCLCLCNTNT0%54%42%4%
Columbia Plateau Western Juniper Woodland and Savanna7784VUVUNT (LC-NT)LCLCLCNTLC0%28%68%5%
Eastern Cool Temperate Forest and Barrens
Laurentian Acadian Northern Hardwood Forest274,173ENENLCLCLCLCDDLC23%64%9%1%
North Central Interior Dry–Mesic Oak Forest and Woodland141,658VUVUVUVULCLCVUVU0%76%23%1%
North Central Interior Beech–Maple Forest88,162ENVUENENLCLCDDCR0%79%18%3%
Laurentian Acadian Pine–Hemlock–Hardwood Forest76,163ENENVU (LC-VU)VULCLCDDLC36%50%10%1%
Ozark Ouachita Dry–Mesic Oak Forest59,722ENENEN (VU-EN)LCLCLCENNT3%91%5%0%
Ozark Ouachita Dry Oak Woodland58,336ENENENVULCLCENDD0%95%5%0%
North Central Interior Maple–Basswood Forest49,899ENVUENENLCLCDDEN0%49%50%1%
Laurentian Acadian Northern Pine–Oak Forest44,841ENENVUVULCLCVUNT16%72%10%0%
Laurentian Pine Oak Barrens3731ENENEN (VU-EN)ENLCLCENVU33%65%1%0%
Eastern Warm Temperate Forest and Woodland
Atlantic Coastal Plain Upland Longleaf Pine Woodland62,261ENVUENENLCLCENEN0%74%25%2%
Western Cool Semidesert and Temperate Shrubland
Inter-Mountain Basins Big Sagebrush Shrubland282,439VUVUNTLCLCLCNTNT0%22%70%8%
Inter-Mountain Basins Big Sagebrush Steppe182,114VUVUVULCLCLCNTVU0%16%74%10%
Inter-Mountain Basins Montane Sagebrush Steppe83,707VUVULCLCLCLCLCLC0%44%46%9%
Great Basin Xeric Mixed Sagebrush Shrubland62,126VUVUVUVULCLCNTNT0%0%70%30%
Northern and Central Californian Dry–Mesic Chaparral20,966VUVUVULCLCLCVUVU0%41%51%7%
Rocky Mountain Gambel Oak–Mixed Montane Shrubland19,637VUVULC (LC-NT)LCLCLCNTLC0%23%65%12%
Mixed Salt Desert Scrub
Inter-Mountain Basins Mixed Salt Desert Scrub95,681VUVUNTNTLCLCNTNT0%38%57%5%
Inter-Mountain Basins Mat Saltbush Shrubland10,677VUVULCLCLCLCDDDD0%40%58%2%
Cool Temperate Mixed Grasslands
Northwestern Great Plains Mixedgrass Prairie620,860VUVUVUVULCLCDDLC0%0%86%14%
Western Great Plains Foothill and Piedmont Grassland12,692VUVUVUVULCLCNTLC0%67%29%4%
Southern Rocky Mountain Montane Subalpine Grassland3087VUVULC (LC-NT)LCLCLCNTLC0%41%43%15%
Cool Temperate Tall Grasslands
Central Mixedgrass Prairie258,932VUVUVUVULCLCDDVU0%44%55%1%
Central Tallgrass Prairie241,651CRVUCRCRLCLCDDCR0%40%60%0%
Northern Tallgrass Prairie157,254CRVUCRCRLCLCDDCR0%22%77%0%
Warm Temperate Grasslands
Western Great Plains Shortgrass Prairie258,868VUVUNTLCLCLCNTLC0%6%87%6%
Southeastern Great Plains Tallgrass Prairie108,030VUVUVUVULCLCDDNT0%0%98%2%
With the subsequent application of RLE Criterion C2b, 2 types still score as CR, but now 9 score as EN, 21 as VU, and no types score as LC and/or NT. Among the three types shifting to EN status from LC/NT or VU were Laurentian Acadian Northern Hardwood Forest, Laurentian Acadian Pine–Hemlock–Hardwood Forest, and Laurentian Acadian Northern Pine–Oak Forest. In each instance, the severity of projected climate exposure interacts with resilience measures to substantially increase relative risk of ecosystem collapse. Among the 12 types shifting to VU status from LC/NT were those types concentrated in western subalpine to montane forests and woodlands (e.g., Rocky Mountain Subalpine Dry–Mesic Spruce–Fir Forest and Woodland, Great Basin Pinyon–Juniper Woodland), cool temperate shrublands and semidesert types (e.g., Inter-Mountain Basins Big Sagebrush Shrubland, Inter-Mountain Basins Montane Sagebrush Steppe, Rocky Mountain Gambel Oak–Mixed Montane Shrubland, Inter-Mountain Basins Mixed Salt Desert Scrub), cool temperate mixed grasslands (Southern Rocky Mountain Montane Subalpine Grassland), and warm temperate grasslands (Western Great Plains Shortgrass Prairie). Higher elevation forests and shrublands among these types have historically escaped extensive landscape fragmentation from intensive land uses, so projected climate stress explains nearly all increases in risk of collapse. Lower elevation shrublands and grasslands among these types have tended to occur in remote arid environments where cattle grazing of varying intensities has degraded natural conditions [25]. Projected climate exposure interacts with these extant stressors to increase overall risk of collapse in these types.
Fully 17 types (51%) in this cross-section of assessed types had RLE scores shift to higher risk categories as a result of those scores contributed by Criterion C2b. That shift was primarily from either LC or NT to VU status. While this cross-section of assessed types does not reflect a statistical sampling of types treated under the RLE, this effect of Criterion C2b could be said to be anticipated when many more types are assessed.

4. Discussion

We have demonstrated an analytical framework to document relative climate change severity in the Red List of Ecosystems assessment among major upland ecosystem types in temperate latitudes of the USA. By integrating available information and using the HCCVI, we identified types, places, relative severity, and proportional areas where signals of climate change stress can be foreseen over the upcoming decades. This directly indicates a pervasive form of environmental degradation suitable for inclusion in red list assessments and may be replicated across all types of ecosystems on the continent.

4.1. Challenges Applying the IUCN RLE Framework

Our study illustrates some of the challenges in applying the IUCN RLE framework. IUCN guidelines [9] built from a risk assessment paradigm suggest that assessors establish what the “collapsed” states of each ecosystem look like in order to scale the relative severity of each component measure. More specific guidance [28] suggests (a) describing initial and collapsed states, (b) describing collapse and recovery transitions, (c) selecting indicators of collapse, and (d) setting quantitative collapse thresholds. This process can be realistic for some RLE measures such as loss in extent over time, i.e., once a given ecosystem type has been converted for intensive land uses, the “collapsed” state is quite apparent. However, for other measures such as environmental degradation, the threshold of ecosystem collapse may only be described qualitatively (e.g., the point where native species composition has been transformed and is no longer “recognizable” as the type originally described in the chosen ecosystem classification [29]). That is, the actual threshold of collapse is generally unknown. This fact was acknowledged in specific guidance [28] as very few if any reviewed studies were able to define this threshold. With climate change interactions with other stressors, establishing a clear quantitative threshold of ecosystem collapse can move from “unknown” to “unknowable”.
Selecting indicators of collapse introduces another challenging dimension to this problem since no matter how well we understand ecosystem processes and functions, practical limitations arise with locating suitable indicator data for assessment, especially when attempting to measure conditions across the entire range of a given ecosystem type.
Therefore, in our experience, e.g., [30,31], this reality suggests a redirected focus on describing and indicating (e.g., along a 0.0–1.0 gradient) the continuum of degradation, and the application of appropriate indicators to provide multiple lines of evidence about the true condition of the ecosystem. We have applied this approach to RLE assessments across North America [4] and for this particular effort.
One could argue that the HCCVI and RLE frameworks overlap with HCCVI measures of climate change sensitivity [10]. Where HCCVI sensitivity measures past and current ecological condition, it can overlap directly with RLE measures under C and D criteria (C1, C3, D1, D3). This could lead to concerns for “double-counting” of factors contributing to ecosystem collapse. We acknowledge this concern. However, given the number of interacting factors contributing to risk of range wide ecosystem collapse, we think this effect is limited, at least with the cross-section of types addressed here (Table 3).

4.2. Advancing the HCCVI in Different Ecosystems

Looking beyond the upland ecosystem types treated here, we anticipate that the HCCVI framework will encompass different component measures for climate exposure and resilience suitable for wetland, freshwater aquatic, and marine ecosystems. We anticipate the need to link climate projections more directly to key ecological processes (e.g., biomass productivity, hydrologic regime, etc.). Similarly, since some factors affecting resilience (e.g., sensitivity measures, some adaptive capacity measures) will change over the upcoming decades, there is an imperative to create reliable forecasts of changing conditions, such as fragmenting effects of land development and spread of invasive species.
However, by applying a systematic framework to climate change severity, we generate actionable information targeted to both policy makers and land managers for adaptation decisions. Emerging examples of “resistance–resilience” frameworks [32,33,34,35] aim to clarify strategies in response to measures of climate change severity where “resistance” is warranted where severity appears low, enhancing resilience is warranted for cases of moderate severity, and more intensive actions may be required to direct ecosystem conditions may be warranted where very high climate change severity is evident. Looking out to the upcoming decades, most types assessed here would benefit from resilience-based strategies, so restorative investments in the near term may limit needs for more extreme measures later in the century.

5. Conclusions

Under the IUCN Red List of Ecosystems framework [2,9], Criterion C2 addresses environmental degradation over a 50-year timeframe including the current time period where degradation is expressed in terms of relative proportional extent of an ecosystem type affected at varying levels of relative severity. Since the HCCVI results can express relative severity of climate change (i.e., very high–low climate change vulnerability) within set timeframes in 4 × 4 km2 increments across the range wide extent of the type, they apply directly to measuring C2 for red listing ecosystems.
While the RLE provides an important overall measure of ecosystem status, it does so by identifying key ecosystem characteristics that have been altered or degraded and can therefore be targeted for restoration and adaptive management. By targeting conservation on abating these targeted stressors and restoring native composition, structure, and dynamic processes, we increase the probability of heading off range wide ecosystem collapse and likely cascading effects on dependent species. In this light, the imperative to establish methods for red listing that integrate emerging patterns of climate change stress becomes clear, as this provides a clear pathway toward climate change adaptation that not only abates current stressors, but also addresses the most likely effects of climate over the upcoming decades. We urge continued investment in this type of analysis, encompassing more types in terrestrial and aquatic ecosystems and across national and international scales. These investments should yield many benefits to natural resource managers and conservation practitioners as they navigate the challenges posed by climate change over the upcoming decades.

Supplementary Materials

The following supporting information can be downloaded at: https://www.mdpi.com/article/10.3390/land11020302/s1, Supplemental File S1: Proportional area for all components and composite HCCVI and RLE scores for each assessed ecosystem type (supplied as separate file). Supplemental File S2: R scripts for data extraction and calculation of HCCVI scores using specified spatial data used in this analysis (supplied as separate file).

Author Contributions

Conceptualization, P.J.C.; Data curation, J.C.H., P.M.; Formal analysis, P.J.C., J.C.H., P.M.; Funding acquisition, P.J.C.; Investigation, P.J.C.; Methodology, P.J.C., J.C.H.; Project administration, P.J.C.; Software, J.C.H., P.M.; Supervision, P.J.C.; Validation, P.J.C.; Visualization, P.J.C.; Writing—original draft, P.J.C.; Writing—review and editing, J.C.H., P.M. All authors have read and agreed to the published version of the manuscript.

Funding

This research received no external funding.

Institutional Review Board Statement

Not applicable.

Informed Consent Statement

Not applicable.

Data Availability Statement

Not applicable.

Acknowledgments

We wish to acknowledge the support of U.S. Department of Interior agencies, primarily the Bureau of Land Management, U.S. Fish and Wildlife Service, and Department of Defense (through the Center for Environmental Management on Military Lands at Colorado State University) who have provided resources for this research. Numerous experts have provided review and insights throughout the design of this method and its implementation.

Conflicts of Interest

The authors declare no conflict of interest.

References

  1. Noss, R.F.; LaRoe, E.T., III; Scott, J.M. Endangered Ecosystems of the United States: A Preliminary Assessment of Loss and Degradation; US Department of the Interior, National Biological Service: Washington, DC, USA, 1995; Volume 28.
  2. Keith, D.A.; Rodríguez, J.P.; Rodriguez-Clark, K.; Nicholson, E.; Aapala, K.; Alonso, A.; Asmussen, M.; Bachman, S.; Basset, A.; Barrow, E.G.; et al. Scientific foundations for an IUCN Red List of Ecosystems. PLoS ONE 2013, 8, e62111. [Google Scholar] [CrossRef] [PubMed] [Green Version]
  3. Comer, P.J. Red Listing Temperate Grasslands and Savannas in North America. In Imperiled: The Encyclopedia of Conservation. Reference Module in Earth Systems and Environmental Sciences; ScienceDirect, Elsevier: Amsterdam, The Netherlands, 2021. [Google Scholar] [CrossRef]
  4. Comer, P.J.; Hak, J.C.; Seddon, E. Documenting at-risk status of terrestrial ecosystems in temperate and tropical North America. Conserv. Sci. Pract. 2022, 4, e603. [Google Scholar] [CrossRef]
  5. Swetnam, T.W.; Betancourt, J.L. Mesoscale disturbance and ecological response to decadal climatic variability in the American Southwest. J. Clim. 1998, 11, 3128–3147. [Google Scholar] [CrossRef]
  6. Wells, P.V. Paleobiogeography of montane islands in the Great Basin since the last glaciopluvial. Ecol. Monogr. 1983, 53, 341–382. [Google Scholar] [CrossRef]
  7. Betancourt, J.L.; Van Devender, T.R.; Martin, P.S. (Eds.) Packrat Middens: The Last 40,000 Years of Biotic Change; University of Arizona Press: Tucson, AZ, USA, 1990. [Google Scholar]
  8. Barros, V.R.; Field, C.B.; Dokken, D.J.; Mastrandrea, M.D.; Mach, K.J.; Bilir, T.E.; Chatterjee, M.; Ebi, K.L.; Estrada, Y.O.; Genova, R.C.; et al. Climate Change 2014: Impacts, Adaptation and Vulnerability: Part B: Regional Aspects: Working Group II Contribution to the Fifth Assessment Report of the Intergovernmental Panel on Climate Change; Cambridge University Press: Cambridge, UK, 2014. [Google Scholar]
  9. Bland, L.M.; Keith, D.A.; Miller, R.M.; Murray, N.J.; Rodriguez, J.P. (Eds.) Guidelines for the Application of IUCN Red List of Ecosystems Categories and Criteria; Version 1.0; IUCN: Gland, Switzerland, 2017; ix + 94pp. [Google Scholar]
  10. Comer, P.J.; Hak, J.C.; Reid, M.S.; Auer, S.L.; Schulz, K.A.; Hamilton, H.H.; Smyth, R.L.; Kling, M.M. Habitat Climate Change Vulnerability Index Applied to Major Vegetation Types of the Western Interior United States. Land 2019, 8, 108. [Google Scholar] [CrossRef] [Green Version]
  11. Comer, P.; Faber-Langendoen, D.; Evans, R.; Gawler, S.; Josse, C.; Kittel, G.; Menard, S.; Pyne, M.; Reid, M.; Schulz, K.; et al. Ecological Systems of the United States: A Working Classification of US Terrestrial Systems; NatureServe: Arlington, VA, USA, 2003. [Google Scholar]
  12. Comer, P.J.; Schulz, K.A. Standardized ecological classification for mesoscale mapping in the southwestern United States. Rangel. Ecol. Manag. 2007, 60, 324–335. [Google Scholar] [CrossRef]
  13. Rollins, M.G. LANDFIRE: A nationally consistent vegetation, wildland fire, and fuel assessment. Int. J. Wildland Fire 2009, 18, 235–249. [Google Scholar] [CrossRef] [Green Version]
  14. Comer, P.J.; Hak, J.C.; Josse, C.; Smyth, R. Long-term loss in extent and current protection of terrestrial ecosystem diversity in the temperate and tropical Americas. PLoS ONE 2020, 15, e0234960. [Google Scholar] [CrossRef]
  15. O’Donnell, M.S.; Ignizio, D.A. Bioclimatic predictors for supporting ecological applications in the conterminous United States. US Geol. Surv. Data Ser. 2012, 691, 4–9. [Google Scholar]
  16. Damschen, E.I.; Baker, D.V.; Bohrer, G.; Nathan, R.; Orrock, J.L.; Turner, J.R.; Brudvig, L.A.; Haddad, N.M.; Levey, D.J.; Tewksbury, J.J. How fragmentation and corridors affect wind dynamics and seed dispersal in open habitats. Proc. Natl. Acad. Sci. USA 2014, 111, 3484–3489. [Google Scholar] [CrossRef] [Green Version]
  17. Pausas, J.G.; Keeley, J.E. Abrupt climate-independent fire regime changes. Ecosystems 2014, 17, 1109–1120. [Google Scholar] [CrossRef]
  18. Krist, F.J., Jr.; Ellenwood, J.R.; Wood, M.E.; McMahan, A.J.; Cowardin, J.P.; Ryerson, D.E.; Sapio, F.J.; Zweifler, M.O.; Romero, A.S. 2027 National Insect and Disease Forest Risk Assessment; USDA Forest Service, Forest Health Technology Enterprise Team: Fort Collins, CO, USA, 2013.
  19. Whitney, G.G. From Coastal Wilderness to Fruited Plain: A History of Environmental Change in Temperate North America from 1500 to the Present; Cambridge University Press: Cambridge, UK, 1996. [Google Scholar]
  20. Noss, R.F.; Franklin, J.F.; Baker, W.L.; Schoennagel, T.; Moyle, P.B. Managing fire-prone forests in the western United States. Front. Ecol. Environ. 2006, 4, 481–487. [Google Scholar] [CrossRef] [Green Version]
  21. Bradley, B.A. Assessing ecosystem threats from global and regional change: Hierarchical modeling of risk to sagebrush ecosystems from climate change, land use and invasive species in Nevada, USA. Ecography 2010, 33, 198–208. [Google Scholar] [CrossRef]
  22. Syphard, A.D.; Brennan, T.J.; Keeley, J.E. Chaparral landscape conversion in southern California. In Valuing Chaparral; Springer: Cham, Switzerland, 2018; pp. 323–346. [Google Scholar]
  23. Fralish, J.S. Community succession, diversity, and disturbance in the central hardwood forest. In Conservation in Highly Fragmented Landscapes; Springer: Boston, MA, USA, 1997; pp. 234–266. [Google Scholar]
  24. Smith, M.D.; Knapp, A.K. Exotic plant species in a C 4-dominated grassland: Invasibility, disturbance, and community structure. Oecologia 1999, 120, 605–612. [Google Scholar] [CrossRef]
  25. Loarie, S.R.; Duffy, P.B.; Hamilton, H.; Asner, G.; Field, C.B.; Ackerly, D. The velocity of climate change. Nature 2009, 462, 1052–1055. [Google Scholar] [CrossRef] [PubMed]
  26. Dobrowski, S.Z.; Abatzoglou, J.; Swanson, A.K.; Greenberg, J.A.; Mynsberge, A.R.; Holden, Z.A.; Schwartz, M.K. The climate velocity of the contiguous U nited S tates during the 20th century. Glob. Chang. Biol. 2013, 19, 241–251. [Google Scholar] [CrossRef] [PubMed] [Green Version]
  27. Sandel, B.; Arge, L.; Dalsgaard, B.; Davies, R.G.; Gaston, K.J.; Sutherland, W.J.; Svenning, J.-C. The influence of Late Quaternary climate-change velocity on species endemism. Science 2011, 334, 660–664. [Google Scholar] [CrossRef] [Green Version]
  28. Bland, L.M.; A Rowland, J.; Regan, T.J.; A Keith, D.; Murray, N.J.; E Lester, R.; Linn, M.; Rodríguez, J.P.; Nicholson, E. Developing a standardized definition of ecosystem collapse for risk assessment. Front. Ecol. Environ. 2018, 16, 29–36. [Google Scholar] [CrossRef]
  29. Dorrough, J.; Tozer, M.; Armstrong, R.; Summerell, G.; Scott, M.L. Quantifying uncertainty in the identification of endangered ecological communities. Conserv. Sci. Pract. 2021, 3, e537. [Google Scholar] [CrossRef]
  30. Unnasch, R.S.; Braun, D.P.; Comer, P.J.; Eckert, G.E. The Ecological Integrity Assessment Framework: A Framework for Assessing the Ecological Integrity of Biological and Ecological Resources of the National Park System (Version 1.1); Natural Resource Report; NPS/NRSS/BRD/NRR—2018/1602; National Park Service: Fort Collins, CO, USA, 2018.
  31. Comer, P.J.; Crist, P.J.; Reid, M.S.; Hak, J.; Hamilton, H.; Braun, D.; Kittel, G.; Varley, I.; Unnasch, B.; Auer, S.; et al. A Rapid Ecoregional Assessment of the Central Basin and Range Ecoregion; Report, Appendices, and Databases Provided to the Bureau of Land Management; BLM: Washington, DC, USA, 2013. [Google Scholar]
  32. Chambers, J.C.; Bradley, B.A.; Brown, C.S.; D’Antonio, C.; Germino, M.J.; Grace, J.B.; Hardegree, S.P.; Miller, R.F.; Pyke, D.A. Resilience to stress and disturbance, and resistance to Bromus tectorum L. invasion in cold desert shrublands of western North America. Ecosystems 2014, 17, 360–375. [Google Scholar] [CrossRef]
  33. Hansen, L.; Biringer, J.L.; Hoffman, J. Buying Time: A User’s Manual to Building Resistance and Resilience to Climate Change in Natural Systems; World Wildlife Fund: Berlin, Germany, 2003. [Google Scholar]
  34. Millar, C.I.; Stephenson, N.L.; Stephens, S.L. Climate change and forests of the future: Managing in the face of uncertainty. Ecol. Appl. 2007, 17, 2145–2151. [Google Scholar] [CrossRef] [PubMed]
  35. Chambers, J.C.; Beck, J.L.; Campbell, S.; Carlson, J.; Christiansen, T.J.; Clause, K.J.; Dinkins, J.B.; Doherty, K.E.; Griffin, K.A.; Havlina, D.W.; et al. Using Resilience and Resistance Concepts to Manage Threats to Sagebrush Ecosystems, Gunnison Sage-Grouse, and Greater Sage-Grouse in Their Eastern Range: A Strategic Multi-Scale Approach; Gen. Tech. Rep. RMRS-GTR-356; U.S. Department of Agriculture, Forest Service, Rocky Mountain Research Station: Fort Collins, CO, USA, 2016; 143p.
Figure 1. Mapped distributions of 33 upland ecological system types in the conterminous USA.
Land 11 00302 g001
Figure 2. Analytical framework for the NatureServe Habitat Climate Change Vulnerability Index (from [10]).
Land 11 00302 g002
Figure 3. (ad) Selected component measures of climate change vulnerability for 2035–2065, including Change in Climate Suitability (a) and overall Climate Exposure (b), Landscape Condition (c) and overall Resilience (d), summarized by 4 × 4 km2 pixels, here displayed for Central Mixedgrass Prairie located from South Dakota south to central Texas.
Land 11 00302 g003
Figure 4. (a,b) Overall climate change vulnerability for 2035–2065 and translated Severity estimate (a), both summarized by 4 × 4 km2 pixels for Central Mixedgrass Prairie, with 55% scores as moderate severity and 44% scores as high severity (b).
Land 11 00302 g004
Table 1. Criteria summary for ecosystem red listing using the IUCN framework, with criteria most applicable to climate change effects highlighted in bold [9].
CriterionABCD
Reduction in DistributionRestricted DistributionEnvironmental DegradationDisruption of Biotic Processes
Application of IndicatorExtent over time:Current extent:Relative severity and extent:Relative severity and extent:
A1. Past 50 yearsB1. Extent of occurrenceC1. Past 50 yearsD1. Past 50 years
A2a. Next 50 yearsB2. Area of occurrenceC2a. Next 50 yearsD2a. Next 50 years
A2b. Any 50 years including presentB3. Number of locationsC2b. Any 50 years including presentD2b. Any 50 years including present
A3. Since 1750 (or pre-industrial land use) C3. Since 1750 (or pre-industrial land use)D3. Since 1750 (or pre-industrial land use)
Table 2. Summary of indicator thresholds for scoring environmental degradation (C2) under the IUCN Framework for Red List of Ecosystems [2,9].
Criterion C2 (a and b)Critically EndangeredEndangeredVulnerable
Environmental degradation based on change in abiotic variables affecting a fraction of the extent of the ecosystem and with relative severity≥80% extent with ≥80% relative severity≥50% extent with ≥80% relative severity≥30% extent with ≥80% relative severity
≥80% extent with ≥50% relative severity≥50% extent with ≥50% relative severity
≥80% extent with ≥30% relative severity
Publisher’s Note: MDPI stays neutral with regard to jurisdictional claims in published maps and institutional affiliations.

